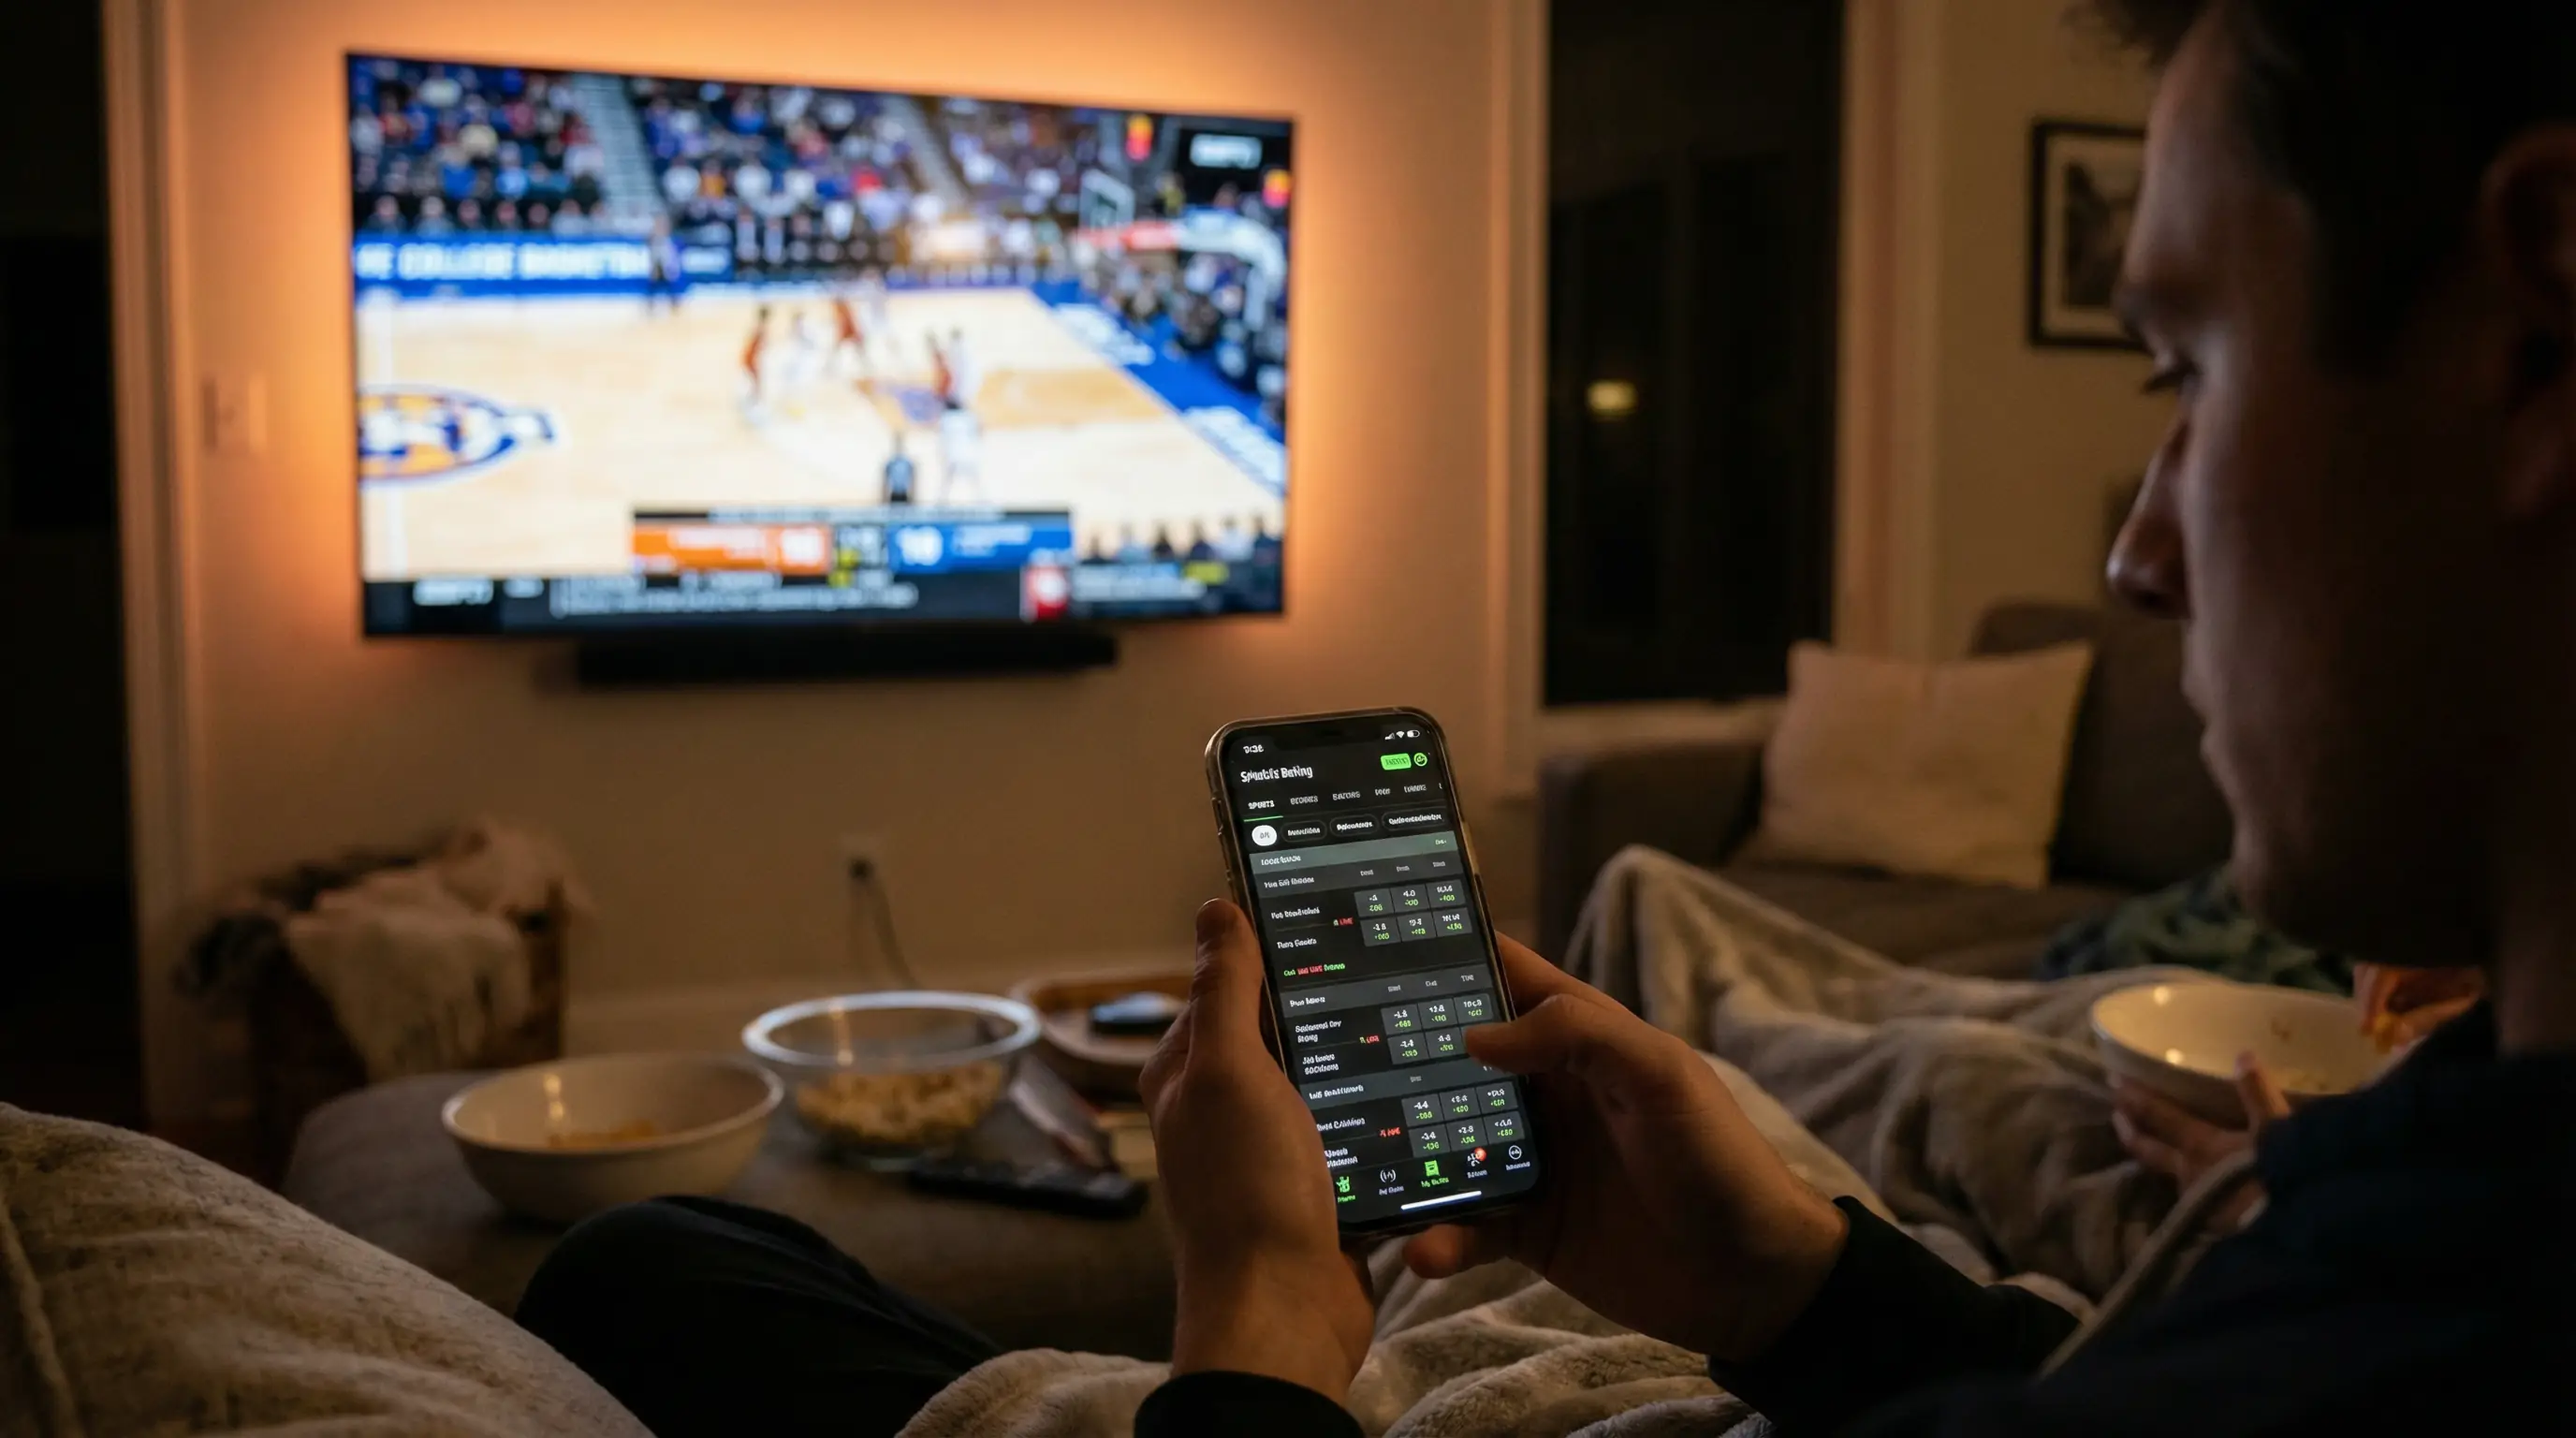
Usage Rate in Props Betting: Leveraging USG% for Scoring Predictions
 Available in US
Luka Doncic carries a 36% usage rate – meaning he’s involved in over a third of Dallas possessions while on court. Betting his scoring props without understanding what that number means is like trying to predict rainfall without checking cloud coverage. Usage rate is the single most predictive statistic for scoring projections, yet most casual prop bettors have never heard of it.
Usage rate measures what percentage of team possessions a player “uses” through shot attempts, free throw attempts, or turnovers while he’s on the floor. It’s not about points scored; it’s about offensive involvement. A player with high usage touches the ball constantly, takes the most shots, and drives offensive flow. Understanding this relationship transforms how you evaluate scoring props.
The NBA attracts approximately 58% of American sports bettors, making it one of the most bet leagues globally. Yet the vast majority of that action comes from bettors who’ve never checked a usage rate. Learning this single metric provides genuine analytical advantage over the recreational mass who bet on names and recent performances.
How Usage Rate Is Calculated
The formula looks intimidating but the concept is simple. Usage rate equals 100 times the sum of a player’s field goal attempts, free throw attempts (multiplied by 0.44 to account for and-ones and technical free throws), and turnovers, divided by team possessions while that player is on court.
In practice, you never need to calculate this yourself. Every basketball statistics site displays usage rate prominently. Basketball-Reference, NBA.com, and prop-specific tools all include it in player profiles. The value comes from interpretation, not computation.
League average usage hovers around 20%. A player at exactly league average uses possessions proportional to having five players on the court – one-fifth of team opportunities. Stars exceed this dramatically; role players fall below.
Usage rates above 30% indicate true offensive centrepieces – players like Doncic, Giannis, and Embiid who anchor entire offensive systems. Usage between 25-30% describes primary scoring options who share responsibility. Usage between 20-25% covers secondary players with defined but limited roles. Below 20% indicates role players who rarely create offence independently.
The Usage-Points Connection
High usage strongly predicts scoring volume. A player with 30% usage will almost certainly outscore one with 15% usage given equal minutes. The relationship isn’t perfect – efficiency matters too – but usage establishes the opportunity ceiling that efficiency operates within.
Think of it mathematically. A team averages perhaps 100 possessions per game. A player with 30% usage, playing 35 minutes of a 48-minute game, is on court for roughly 73% of possessions – call it 73 possessions. At 30% usage, he’s involved in about 22 of those possessions through shots, free throws, or turnovers.
Those 22 offensive involvements translate to scoring opportunity. Even at modest efficiency – say 1.1 points per involvement – that’s 24 expected points. Higher usage with similar efficiency produces more points; lower usage produces fewer. The maths is direct.
Points props in the 2025-26 season hit at only 55.7% for systematic bettors precisely because this relationship is well-understood and heavily priced. Bookmakers know usage correlates with scoring. Finding value requires going beyond usage alone – looking for efficiency changes, matchup effects, or minutes variations that usage doesn’t capture.
When Usage Spikes
The most valuable usage analysis involves predicting changes from baseline rates. When will a player’s usage increase above his season average? These spikes create prop betting opportunities if bookmakers price based on averages rather than game-specific projections.
Teammate injuries produce the most dramatic usage spikes. When a team’s primary scorer sits, remaining players absorb those possessions. A player with 22% normal usage might spike to 28-30% with the lead scorer absent. That’s significantly more offensive involvement than his props – based on season averages – might reflect.
Matchup-driven usage shifts occur when coaches target specific defenders. An opposing team might have elite perimeter defence but weak interior protection. The coaching staff might deliberately funnel possessions to their big man rather than guards. Usage for that big man rises; wing usage falls.
Motivational games affect usage allocation. Players returning to face former teams often see elevated usage as coaches indulge their desire for big performances. Contract-year players down the stretch sometimes see usage spikes as teams showcase them for future contracts.
Back-to-back games produce unpredictable usage shifts. Primary options might see managed loads while secondary players absorb minutes and possessions. Projecting these shifts requires understanding team philosophy about rest management.
Practical Usage Thresholds
Calibrate your expectations using usage tiers. These benchmarks help you quickly assess what’s reasonable for different player types.
Elite usage (32%+) means MVP-calibre offensive load. Only five to eight players sustain this level in any season. Their scoring floors are extremely high – these players rarely post single-digit point totals simply because they touch the ball so much. Their props carry efficiently-priced lines as a result.
High usage (27-31%) describes first-option scorers who anchor offences without carrying historically extreme loads. Expect these players to score 20+ points consistently. Unders become attractive only with specific negative factors – tough matchups, foul trouble, blowout risk reducing minutes.
Moderate usage (22-26%) covers secondary options and featured role players. Their scoring depends more on game flow and shot availability. Props in the 14-20 point range see more variance because opportunities aren’t guaranteed the way they are for higher-usage players.
Low usage (below 22%) indicates players whose scoring comes opportunistically. Their props are harder to predict because they’re not creating shots – they’re waiting for shots to come to them. Matchup and game flow dominate outcomes more than underlying talent.
Finding Current Usage Data
Basketball-Reference displays usage rate in player season statistics pages. Look for “USG%” in the advanced stats section. Historical data lets you compare current usage to career patterns – is this player’s usage abnormally high or low this season?
NBA.com’s stats section includes usage in their advanced metrics. The interface requires more navigation but offers real-time data that may update faster than third-party sites during the season.
Game-by-game usage logs reveal variance patterns. A player might average 25% usage but swing between 20% and 30% depending on game flow. Understanding this variance helps you assess whether a player’s high-usage game is sustainable or represented an outlier to regress from.
Projecting usage changes remains more art than science. Injury-related spikes are quantifiable; motivational and matchup effects require judgment. Build a reference showing how specific players have responded to similar situations historically, then apply that pattern to current projections.
The broader analytical framework in our basketball prop bets guide shows how usage integrates with minutes, matchup, and pace factors. Usage provides the offensive involvement foundation; the complete picture requires layering additional context onto that base.
What usage rate is considered high in the NBA?
Usage above 30% indicates an elite offensive centrepiece – only five to eight players sustain this level each season. Usage between 27-31% describes a primary scoring option. Usage between 22-26% covers secondary options and featured role players. League average sits around 20%, with anything below indicating a player who rarely creates offence independently.
How do I find current usage rate data?
Basketball-Reference displays usage rate as USG% in player advanced stats sections, including game-by-game logs. NBA.com’s statistics section also includes usage in advanced metrics. Both sources provide historical data to compare current usage against career patterns and identify whether a player’s current usage represents normal levels or an outlier.
Prepared by the Basketball Prop Bets editorial staff.